DiagrammerGPT: Generating Open-Domain,
Open-Platform Diagrams via LLM Planning

UNC Chapel Hill

Abstract

Text-to-image (T2I) generation has seen significant growth over the past few years. Despite this, there has been little work on generating diagrams with T2I models. A diagram is a symbolic/schematic representation that explains information using structurally rich and spatially complex visualizations (e.g., a dense combination of related objects, text labels, directional arrows, connection lines, etc.). Existing state-of-the-art T2I models often fail at diagram generation because they lack fine-grained object layout control when many objects are densely connected via complex relations such as arrows/lines and also often fail to render comprehensible text labels.

To address this gap, we present DiagrammerGPT, a novel two-stage text-to-diagram generation framework that leverages the layout guidance capabilities of LLMs (e.g., GPT-4) to generate more accurate open-domain, open-platform diagrams. In the first stage, we use LLMs to generate and iteratively refine 'diagram plans' (in a planner-auditor feedback loop) which describe all the entities (objects and text labels), their relationships (arrows or lines), and their bounding box layouts. In the second stage, we use a diagram generator, DiagramGLIGEN, and a text label rendering module to generate diagrams following the diagram plans. To benchmark the text-to-diagram generation task, we introduce AI2D-Caption, a densely annotated diagram dataset built on top of the AI2D dataset. We show quantitatively and qualitatively that our DiagrammerGPT framework produces more accurate diagrams, outperforming existing T2I models. We also provide comprehensive analysis including open-domain diagram generation, vector graphic diagram generation in different platforms, human-in-the-loop diagram plan editing, and multimodal planner/auditor LLMs (e.g., GPT-4Vision).

We hope that our work can inspire further research on the diagram generation capabilities of T2I models and LLMs.

Summary

Teaser
Figure 1. An overview of DiagrammerGPT, our two-stage framework for open-domain, open-platform diagram generation. In the first diagram planning stage (Sec. 3.1), given a prompt, our LLM (GPT-4) generates a diagram plan,which consists of dense entities (objects and text labels), fine-grained relationships (between the entities), and precise layouts (2D bounding boxes of entities). Then, the LLM iteratively refines the diagram plan (i.e., updating the plan to better align with the input prompts). In the second diagram generation stage (Sec. 3.2), our DiagramGLIGEN outputs the diagram given the diagram plan, then, we render the text labels on the diagram.


Stage 1: Diagram Planning

Teaser
Figure 2. Illustration of the first stage of DiagrammerGPT: diagram planning (Sec. 3.1). We use a planner LLM (e.g., GPT-4) to create the fine-grained layouts of diagrams, which we call diagram plans. We first generate an initial diagram from the input text prompt with an LLM (left). Then we iteratively refine diagram plans in a feedback loop of the planner and auditor LLMs, where the planner and auditor LLMs are based on the same LLM architecture with different preambles (right).

We first generate diagram plans with a planner LLM (GPT-4) via in-context learning. A diagram plan consists of three components: (1) entities - a dense list of objects (e.g., larva in Fig. 2) and text labels (e.g., “egg” in Fig. 2); (2) relationships - complex relationships between entities (e.g., objectobject relationship “[obj 0] has an arrow to [obj 1]” or object-text label relationship “[text label 0] labels [obj 0]”); (3) layouts - 2D bounding boxes of the entities (e.g., “[obj 0]: [20, 30, 14, 14]” in Fig. 2). For object-object relationships, we utilize two types: line and arrow (a line with explicit start and end entities), which are useful when specifying object relationships in diagrams such as flow charts or life cycles. For object-text label relationships, we specify which object each label refers to. For layouts, we use the [x, y, w, h] format for 2D bounding boxes, whose coordinates are normalized and integer-quantized within {0, 1, · · · 100}.

Then, we introduce an auditor LLM that checks for any mismatch between the current diagram plan and the input prompt. It then provides feedback, enabling the planner LLM to refine the diagram plans. Our auditor and planner LLMs form a feedback loop to iteratively refine the diagram plans.


Stage 2: Diagram Generation

Teaser
Figure 3. Illustration of the second stage of DiagrammerGPT: diagram generation (Sec. 3.2). We first generate the objects following the layouts in diagram plan with DiagramGLIGEN, our layout-guided diagram generation model. Then we use the Pillow Python package to render comprehensible text labels.

While existing text-to-image generation models demonstrate photorealistic image generation capabilities, in the text-to-diagram generation task, conveying factual information from the text description is more crucial than producing realistic objects. In our experiments, we observe that Stable Diffusion v1.4, a recent strong text-to-image generation model, often omits important objects, generates incorrect relationships between objects, and generates unreadable text labels (see Sec. 5 and Fig. 5). To tackle these issues, we introduce DiagramGLIGEN, a layout-guided diagram generation model capable of leveraging the knowledge of text-to-image generation models while adhering closely to the diagram plans. We train DiagramGLIGEN on our new AI2D-Caption dataset (see Sec. 4.1 for details), which contains annotations of overall diagram captions and bounding-box descriptions for 4.8K scientific diagrams extended from the AI2D dataset.

In our diagram generation pipeline, instead of relying on diffusion models for pixel-level generation of text labels, we explicitly render clear text labels on the diagrams following diagram plan with the Pillow Python package.

Quantitative Results


Main Results

Teaser
Table 1. Comparison of DiagrammerGPT to existing text-to-image generation baseline models. On all metrics, DiagrammerGPT outperforms the baselines, indicating that our method is more effective for generating accurate diagrams.

Table 1 left block shows the VPEval results. For both Stable Diffusion v1.4 and VPGen baselines, fine-tuning improves the score for object skill (e.g., 70.1 → 75.4 for Stable Diffusion v1.4, and 64.1 → 69.1 for VPGen), but does not help much or sometimes decreasing scores for count (48.1 → 44.3 for Stable Diffusion v1.4, and 39.2 → 41.8 for VPGen). For relationships, it hurts Stable Diffusion v1.4 slightly (76.7 → 73.7) and helps VPGen (69.8 → 74.6 for). For text, both models achieve 0 scores before and after fine-tuning. Our DiagrammerGPT outperforms both zeroshot and fine-tuned baselines on both overall and skill-specific VPEval scores, showcasing the strong layout control, object relationship representation, and accurate text rendering capability of our diagram generation framework.

Table 1 middle block shows captioning scores (with LLaVA 1.5). Our DiagrammerGPT outperforms both the zeroshot and fine-tuned baselines indicating our generated diagrams have more relevant information to the input prompt than the baselines (which is a critical aspect of diagrams). Our DiagrammerGPT significantly outperforms both fine-tuned VPGen (31.7 vs. 4.2) and fine-tuned Stable Diffusion v1.4 (31.7 vs. 18.2) for CIDEr and also achieves a few higher points on BERTScore.

Table 1 right block shows CLIPScore (with CLIP-ViT L/14). Our DiagrammerGPT outperforms the zeroshot and fine-tuned baselines indicating our generated diagrams more closely reflect the input prompt (image-text similarity) and resemble the ground-truth diagrams (image-image alignment). For CLIPScoreImg-Txt, DiagrammerGPT has slight improvement over fine-tuned Stable Diffusion v1.4 (32.9 vs. 30.1). For CLIPScoreImg-Img, DiagrammerGPT has a larger improvement over fine-tuned Stable Diffusion v1.4 (74.5 vs. 68.1).


Human Evaluation

Teaser
Table 2. Human evaluation of pairwise preferences between our DiagrammerGPT and Stable Diffusion v1.4 regarding both image-text alignment and object relationships.

As discussed in Sec. 4.4, we conduct a human preference study, comparing our DiagrammerGPT and its closest/the strongest baseline, fine-tuned Stable Diffusion v1.4 in image-text alignment and object relationships. As shown in Table 2, our DiagrammerGPT achieves a higher preference than Stable Diffusion v1.4 in both image-text alignment (36% vs 20%) and object relationships (48% vs 30%) criteria

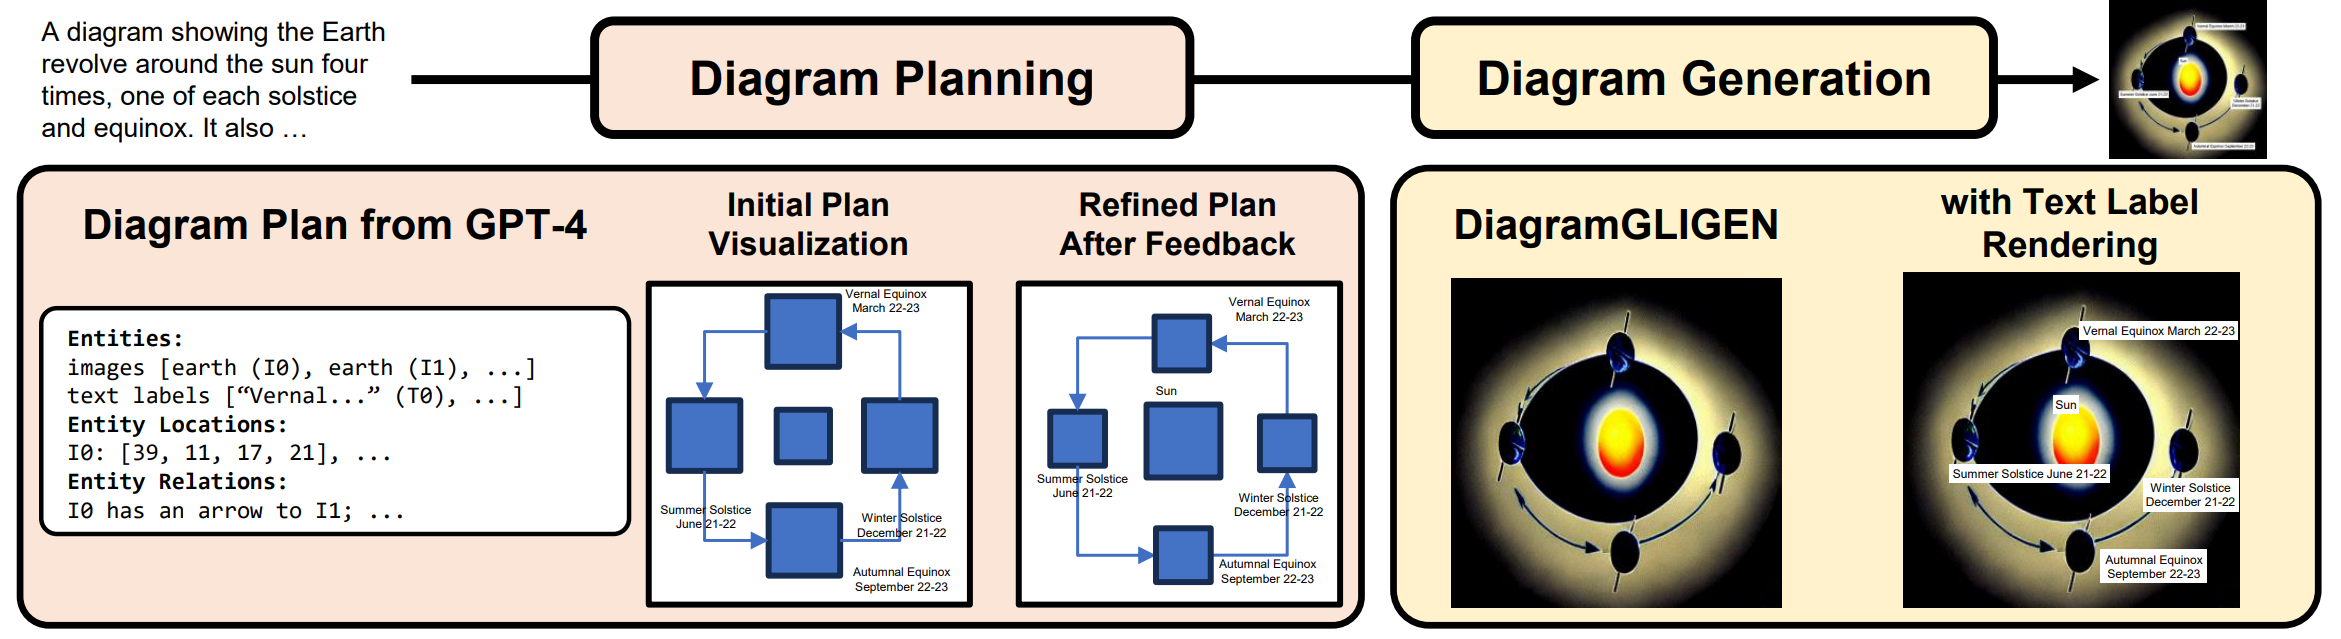
Qualitative Examples & Analysis


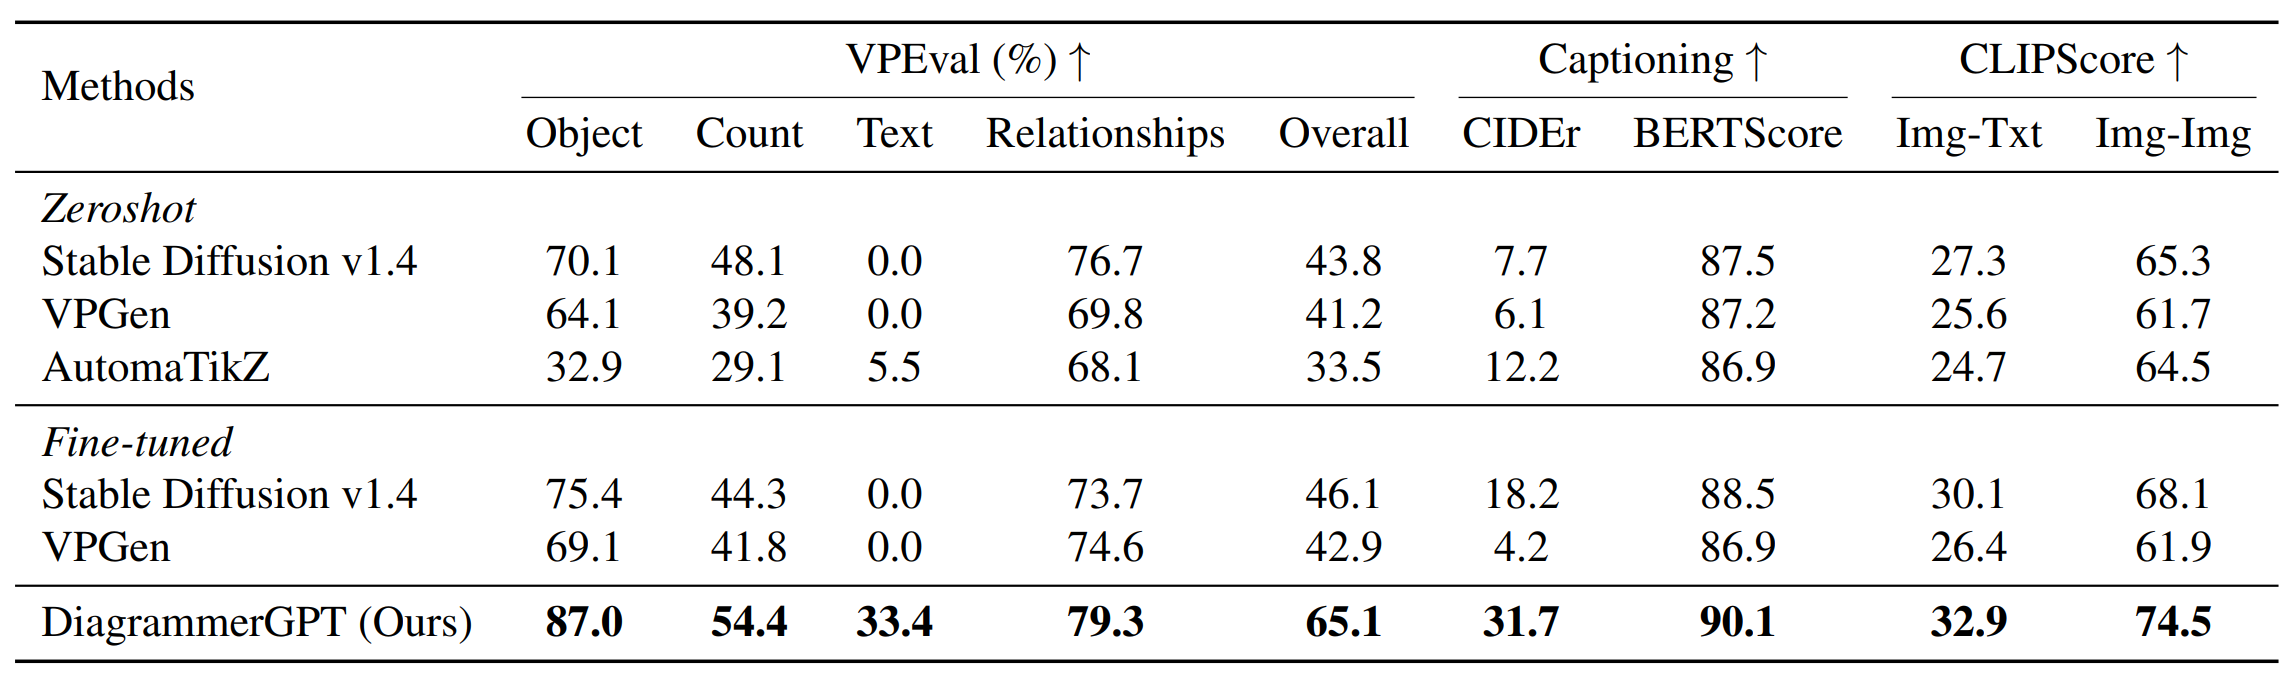
Comparison with Baselines

Teaser
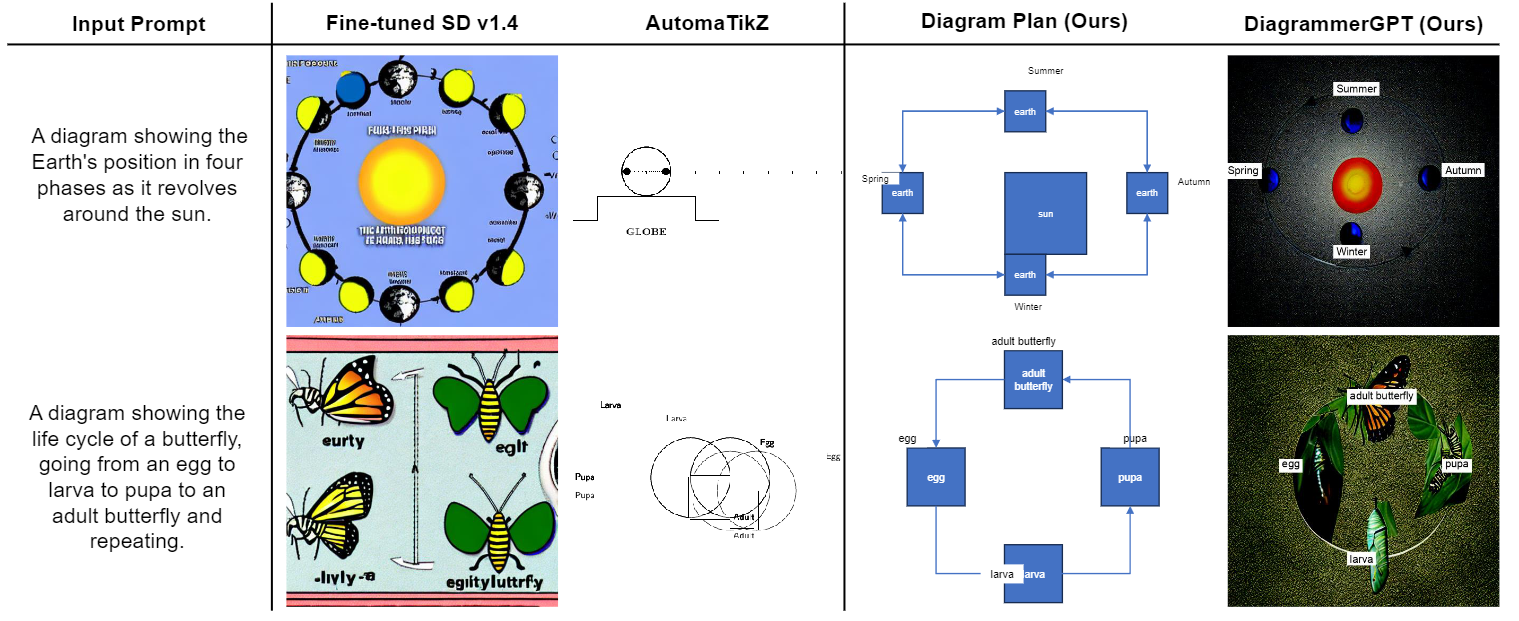
Figure 5. Example diagram generation results from baselines (fine-tuned Stable Diffusion v1.4 and AutomaTikZ) and our DiagrammerGPT (both diagram plan and final diagram) on the AI2D-Caption test split. In the first example, our DiagrammerGPT correctly gets the object count right and has clear text, whereas Stable Diffusion v1.4 overpopulates the entities orbiting around the sun. In the second example, our DiagrammerGPT generates a quite accurate diagram plan (with all required elements) and a diagram that mostly reflects the plan, whereas Stable Diffusion v1.4 fails to show a life cycle (i.e., missing the egg, pupa, and larva). As noted in Sec. 5.2, once a better backbone becomes available, our DiagrammerGPT can produce better diagrams based on the diagram plans. AutomaTikZ struggles to generate the proper layouts and objects for both examples.
Fig. 5 shows example diagrams generated by the baselines (Stable Diffusion v1.4 and AutomaTikZ) and our DiagrammerGPT (both diagram plan and final generation diagram) on the AI2D-Caption test split. Our diagram plans strongly reflect the prompts and the final diagrams are more aligned to the input prompts. In Fig. 5 top example, our diagram correctly shows the earth in four phases revolving around the sun and in the second example, our diagram plan correctly represents the life cycle of a butterfly and the generated diagram captures the circular flow of the diagram plan as well most aspects of the life cycle. Stable Diffusion v1.4 either over- or under-generates objects in the image (e.g., too many earths in the first example and missing egg/larva/pupa stages in Fig. 5 bottom example), and AutomaTikZ fails to generate proper layouts and objects. Although our generated diagram plans are generally correct, however, sometimes DiagramGLIGEN can fail to properly follow all aspects (e.g., the egg is misdrawn and the larva/pupa are swapped in Fig. 5 bottom example). As noted in Sec. 5.2, once a better backbone becomes available, our DiagramGLIGEN can produce better diagrams following the diagram plans.


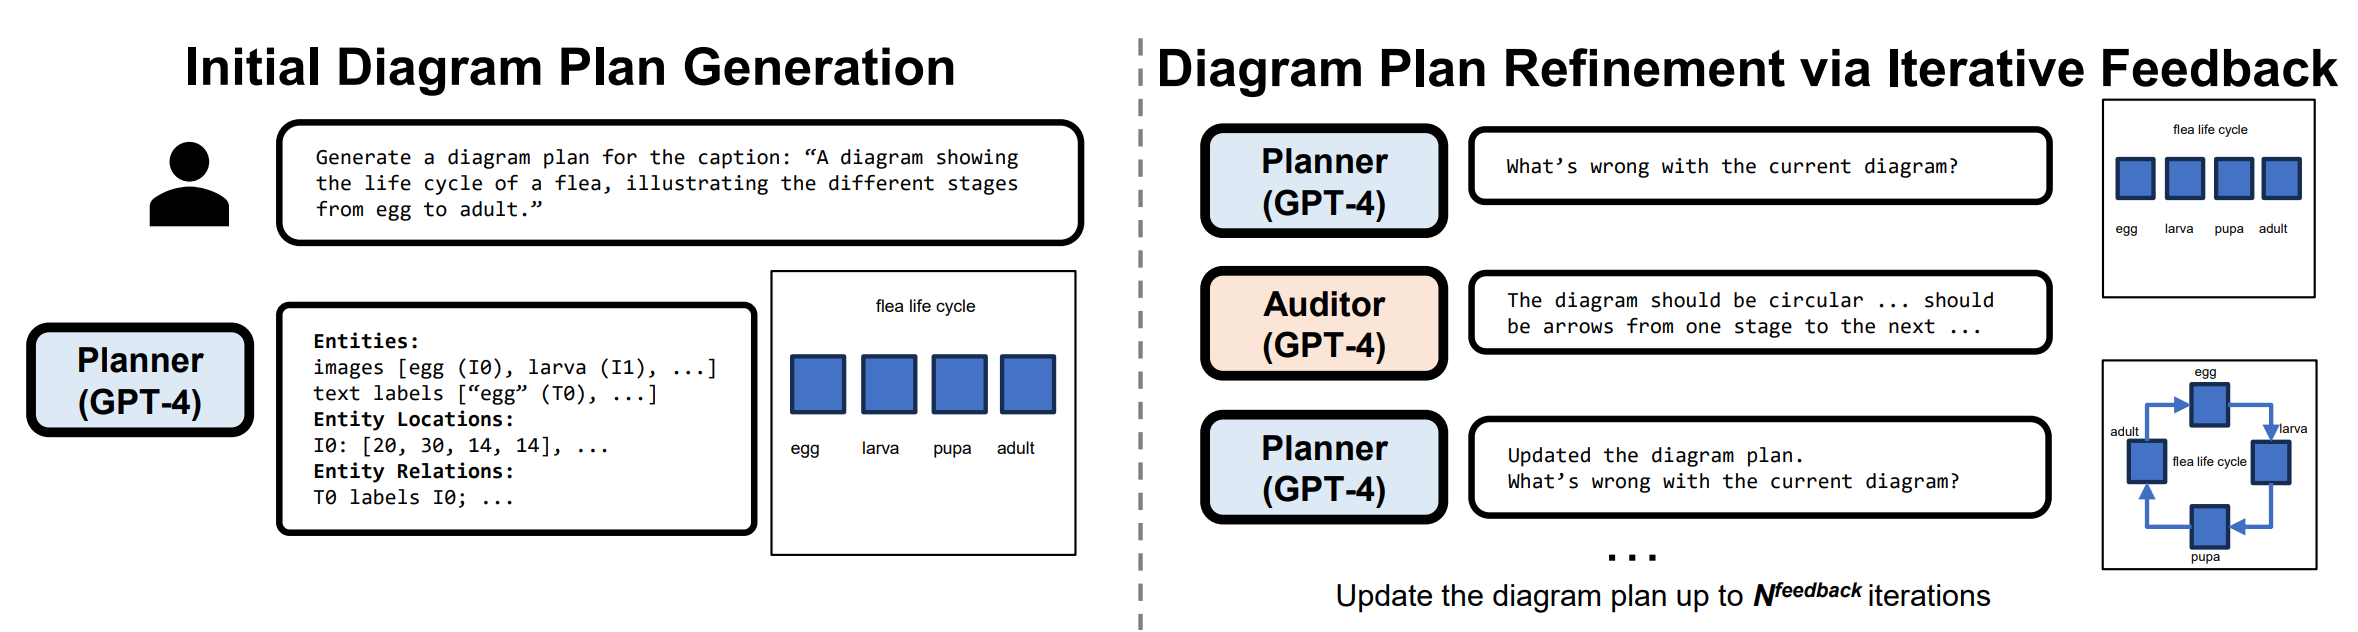
Diagram Plan Refinement

Teaser
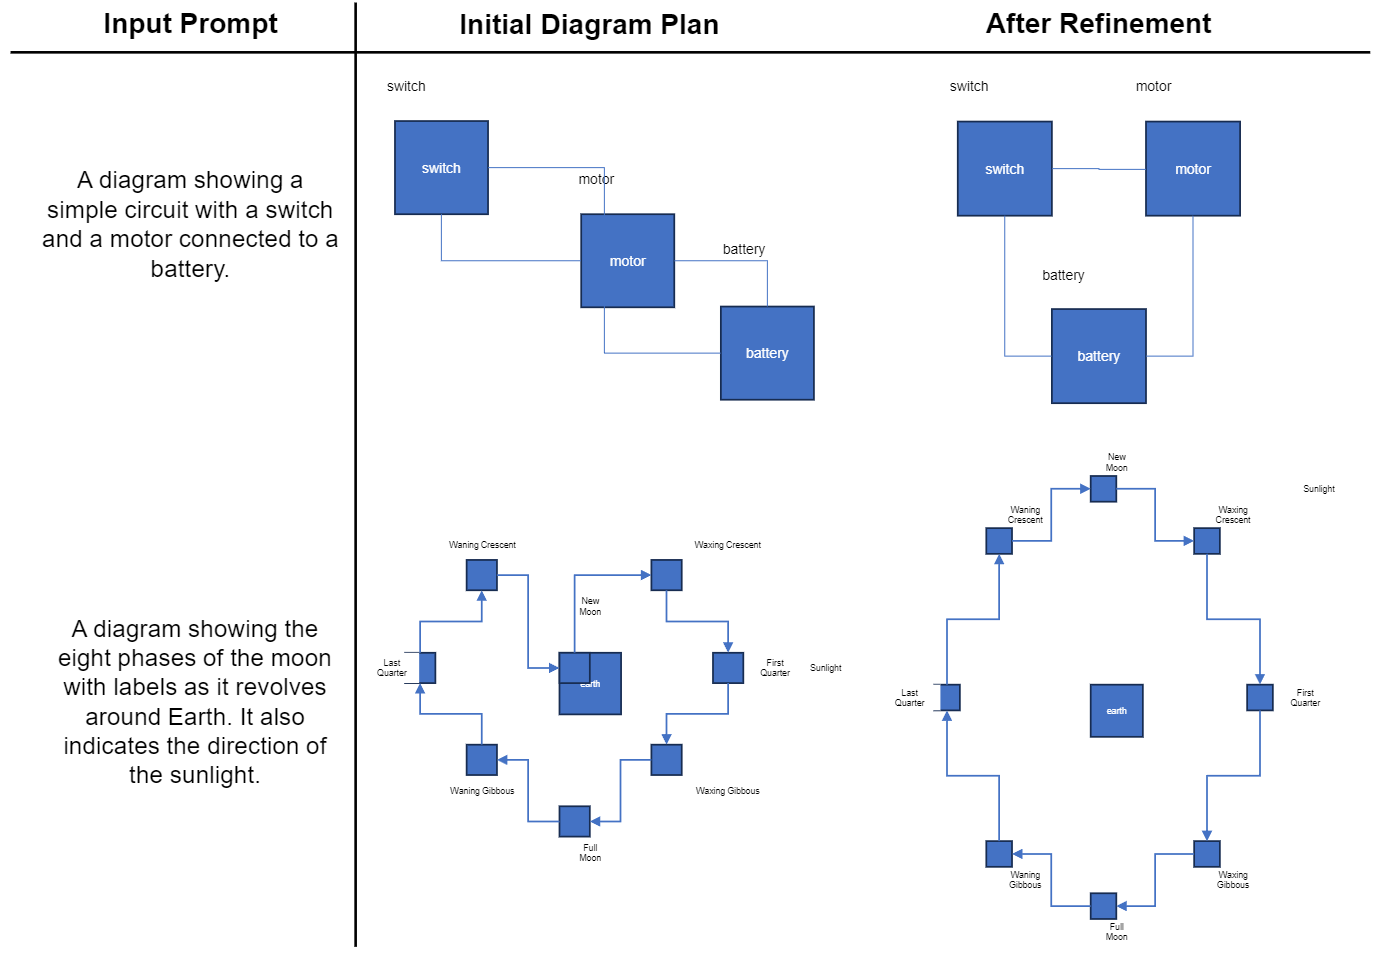
Figure 6. Examples from our diagram refinement step. Our auditor LLM can help reorganize the connections between the components to be more clear in the first example and prevent overlaps of objects in the second example
In Fig. 6, we show how our diagram refinement step (see Sec. 3.1) improves the diagram plans. In the top example, the switch is not connected to the battery, thus does not affect the circuit. After refinement, the connections are corrected so the switch is now also connected to the circuit and the layouts are adjusted to have a more straightforward flow. In the bottom example, the moon phase of 'New Moon' is too low and overlaps with the 'Earth' object. After refinement, there is no more overlap.


Open-Domain Diagram Generation

Teaser
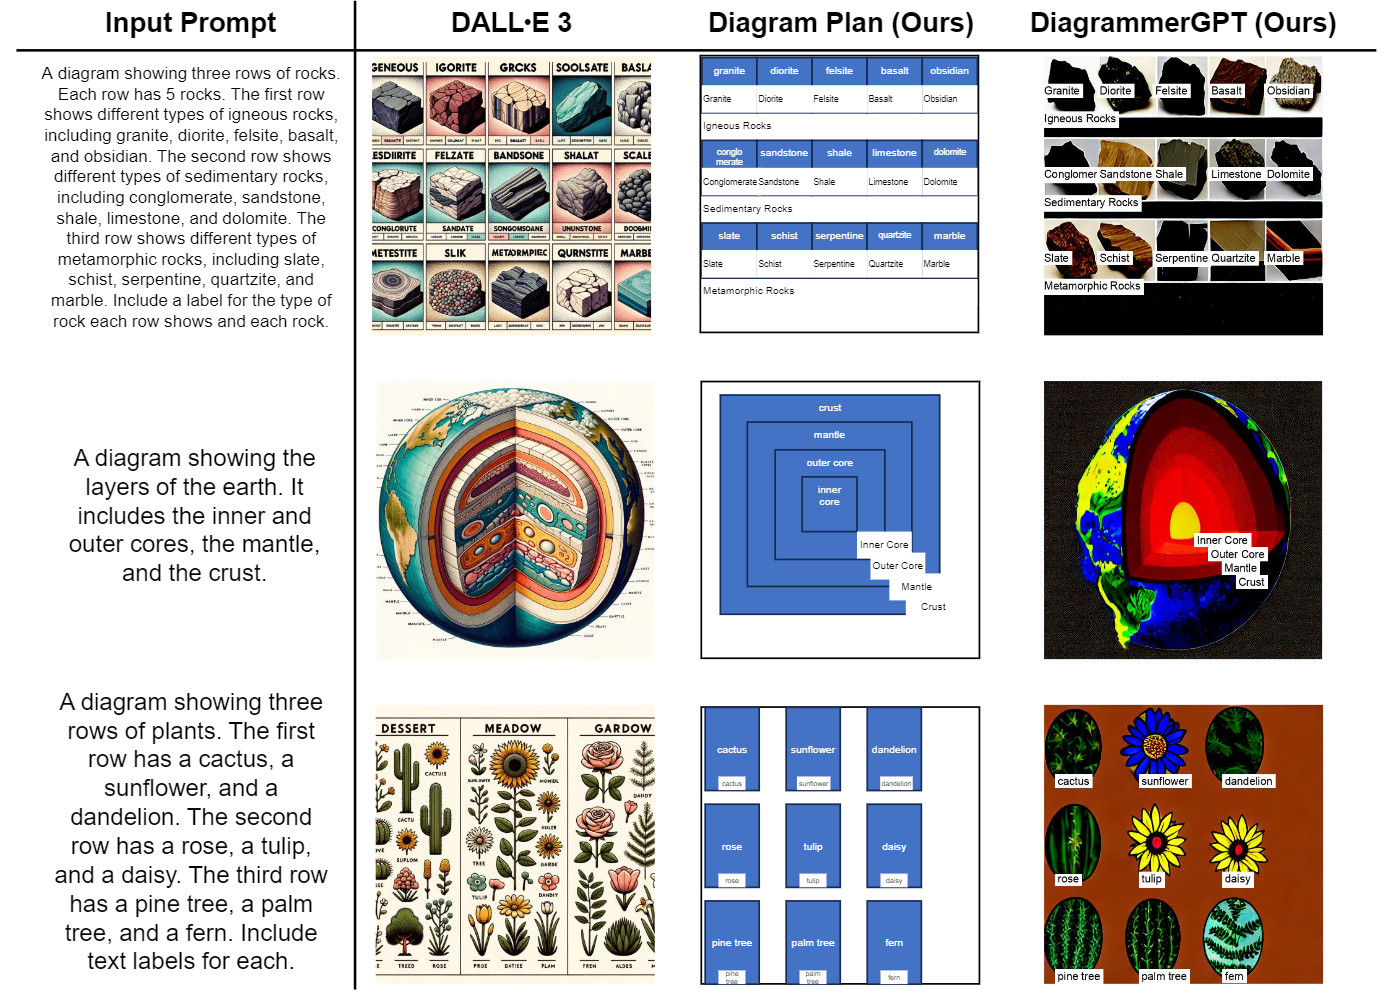
Figure 7. Examples of open-domain generation demonstrate that our DiagrammerGPT can create diagrams that adhere to the input text prompts. Although DALL-E 3 yields images with superior visual quality, it tends to generate diagrams with redundant and crowded objects and also struggles to follow the prompt accurately (e.g., in the second example, it is not clear where the locations of layers such as the 'inner core', 'outer core', and 'mantle' are. In the third example, it generates too many objects that are not in rows).
In Fig. 7, we demonstrate that our planner LLM can extend its capabilities to domains beyond the three specific areas (astronomy, biology, and engineering) for which we have in-context examples. As shown in the figure, our planner LLM generates fairly accurate layouts. While our DiagramGLIGEN struggles in some cases, it is able to strongly adhere to the diagram plan. As mentioned in Sec. 5.2, once a stronger layout-guided image generation model than GLIGEN with Stable Diffusion v1.4 backbone is available, our DiagrammerGPT can produce higher quality results. In Fig. 7, we also compare the recently released DALL-E 3 model. We find that DALL-E 3 generally produces images with good aesthetic style but tends to generate diagrams with redundant and crowded objects (e.g., excessive unnecessary text descriptions in the rock and Earth examples, and an overabundance of plants in the third example). It also continues to struggle with creating accurate diagrams that adhere to a prompt (e.g., generating incorrect layers in the earth example and generating three columns of plants instead of three rows in the plant example). The DALL-E 3 system card also notes that DALL-E 3 tends to generate scientifically inaccurate information in diagrams


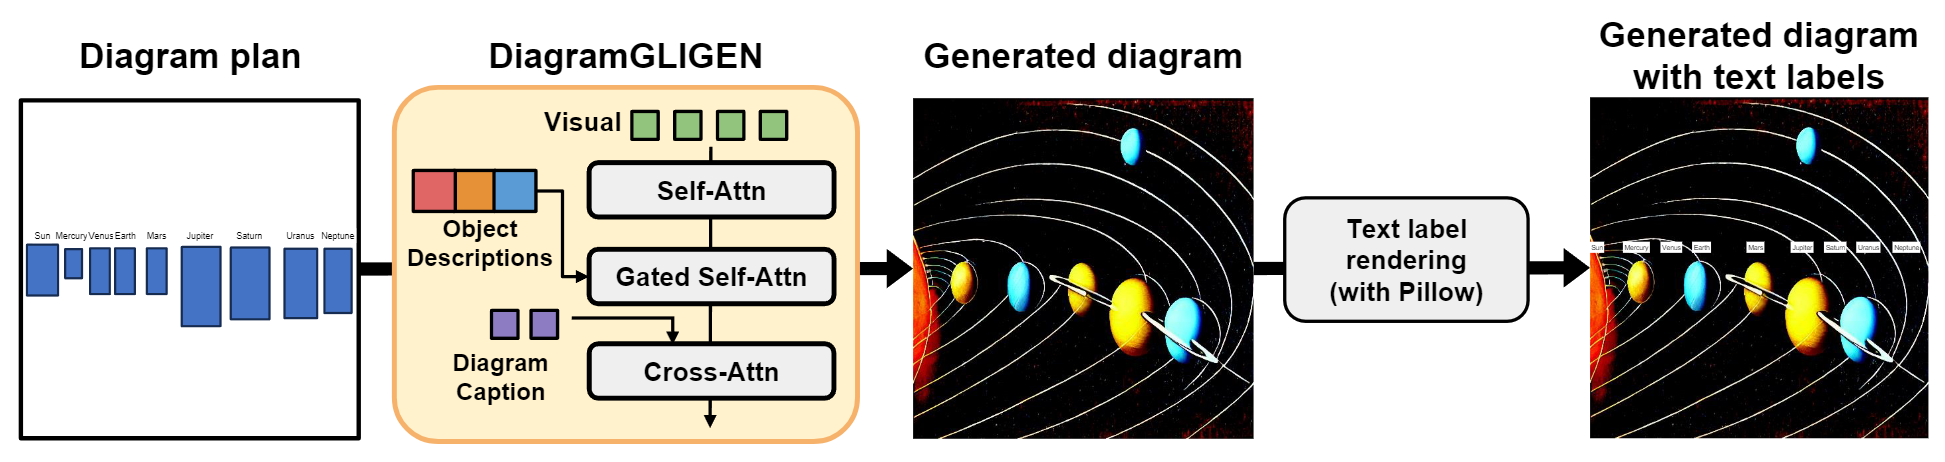
Vector Graphic Diagram Generation in Different Platforms

Teaser
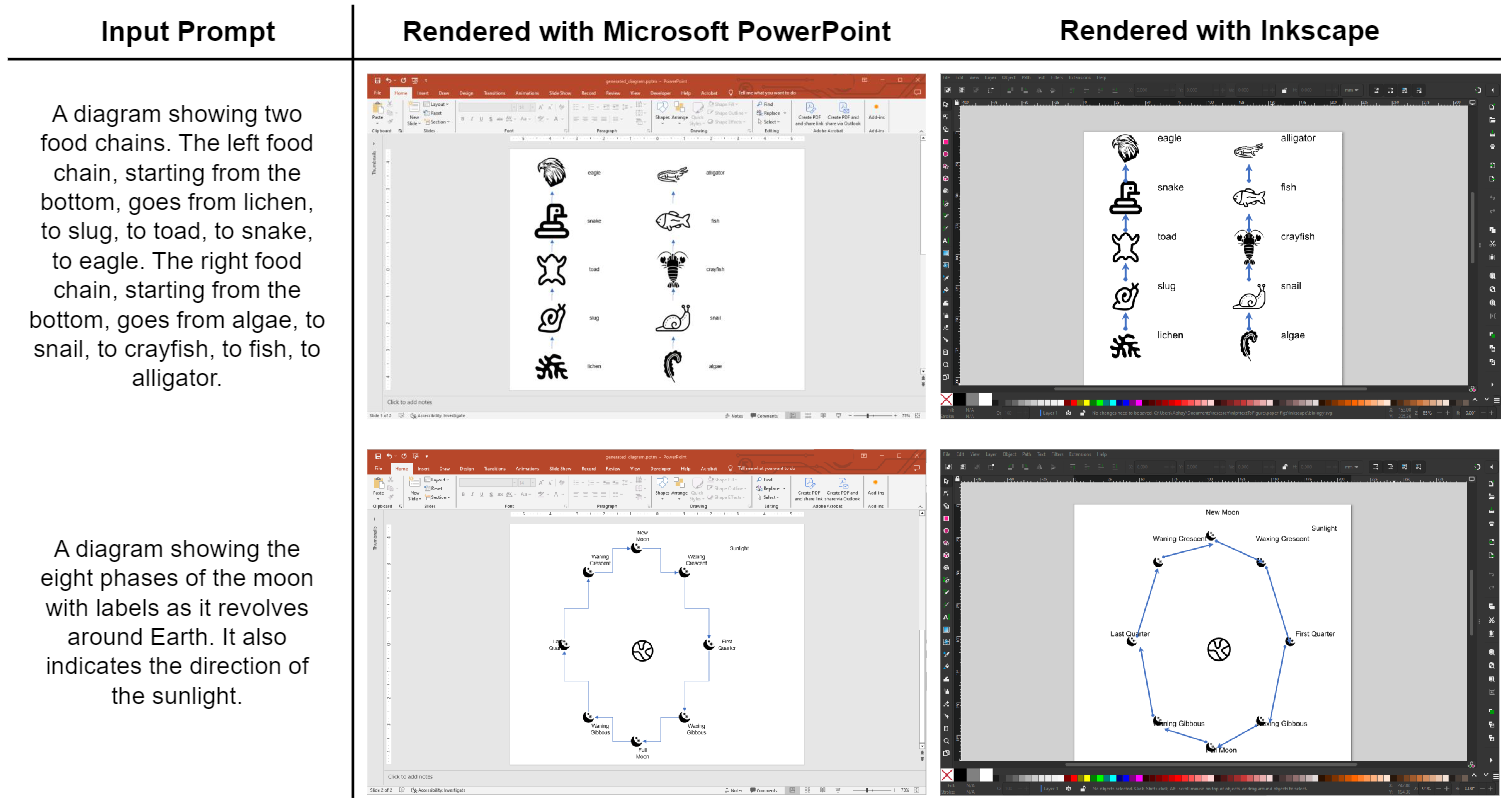
Figure 8. Examples of vector graphic diagrams generated with our diagram plans and exported into Microsoft PowerPoint and Inkscape (with icons from Noun Project Icons API).
Although our primary focus is on a pixel-level diagram generation pipeline with DiagramGLIGEN, our diagram plans can also facilitate the creation of vector graphic diagrams. These diagrams afford users significant flexibility for further edits and personalization of their diagram layouts, such as changing colors, fonts, and object positions, or altering the diagram size without degrading quality. To achieve this, we render our diagram plans in PowerPoint via VBA language and in Inkscape via a Python scripting extension (see Fig. 8). While we experiment with these two platforms, our diagram plans can be flexibly exported to any platform that supports script integration. In both platforms, we integrate features for text and arrows/lines to delineate object text labels and relationships respectively. We represent objects using icons, which are retrieved via the Noun Project Icons API based on corresponding text descriptions.


Human-in-the-Loop Diagram Plan Editing

Teaser
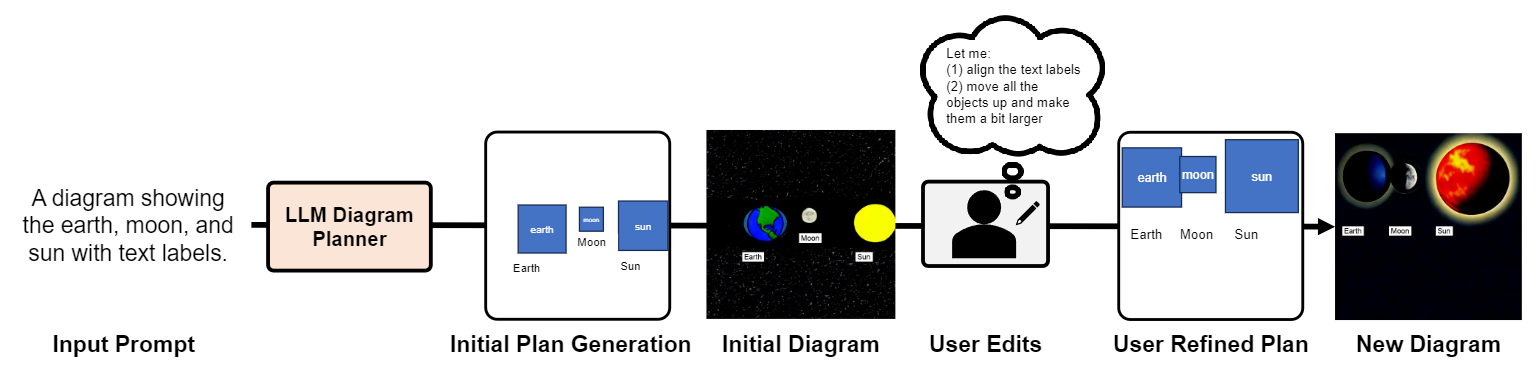
Figure 9. An illustration of human-in-the-loop diagram plan editing. Our DiagrammerGPT first provides an initial diagram plan with the corresponding generated diagram, users can then review the generated layouts/diagrams and make adjustments based on their needs. With the user-refined diagram plan, our DiagramGLIGEN creates diagrams that better suit the users' requirements
With the diagram plans being rendered in vector graphic platforms, as mentioned above, our DiagrammerGPT can provide an editable diagram plan, allowing for human-in-the-loop editing. As illustrated in Fig. 9, our framework first generates an initial diagram plan along with the rendered image. Users can then review the generated layouts/diagrams and make adjustments based on their needs/wants (e.g., move the objects, add/remove objects, adjust object sizes, etc.). With the human-refined diagram plan, users can either keep it in vector format and use icons (as mentioned in the previous paragraph) or give it back to DiagramGLIGEN and then create pixel-level diagrams, resulting in diagrams/layouts that are better suited to end-users requirements.


Limitations

Our DiagrammerGPT framework is for research purposes and is not intended for commercial use (and therefore should be used with caution in real-world applications, with human supervision, e.g., as described in Sec. 5.4 human-in-the-loop diagram plan editing).

BibTeX


@article{Zala2023DiagrammerGPT,
        author = {Abhay Zala and Han Lin and Jaemin Cho and Mohit Bansal},
        title = {DiagrammerGPT: Generating Open-Domain, Open-Platform Diagrams via LLM Planning},
        year = {2023},
}